![]()
![]()
Key Features:
- Effortless Exploration: Easily navigate and understand the structure of your DQMH projects.
- Efficient Editing: Modify code quickly and effectively with built-in tools.
- Visualize and Edit: Easily view and modify your DQMH project documentation, including project, library, and VI descriptions.
- DQMH Scripting Tools: Utilize all the DQMH® Framework Scripting tools using buttons.
- PantherLAB Scripting Tools: Utilize a suite of scripts to streamline tasks like identifying launching module locations, finding event callers, create error and constant vis, etc.
Team Collaboration and Source Control
Panther Dashboard generates a binary file, pantherscan.target.bin, located alongside your LabVIEW project. This file is critical for loading your project and DQMH modules.
⚠️ Important: This binary file utilizes absolute file paths for all project components (.lvproj), libraries (.lvlib), and VIs (.vi).
To avoid broken links when collaborating:
Ensure all team members clone the repository to the identical absolute path on their local machines.
Maintaining a consistent directory structure is required to ensure the dashboard loads correctly.
Getting Started
- Open your LabVIEW project.
- (1) Navigate to Tools ➡️ (2) PantherLAB ➡️ (3) Panther Dashboard for DQMH
Typical Workflows:
- Open LabVIEW Project: Open your LabVIEW project, then launch Panther Dashboard. Select the project and target, and Panther Dashboard will scan it for DQMH modules.
- Recent Projects: If you’ve recently worked on a project, you can quickly access it from the “Recent Projects” list within the Panther Dashboard.
- Open DQMH Project: Launch Panther Dashboard and click the “Open DQMH Project” button to browse and select your project.
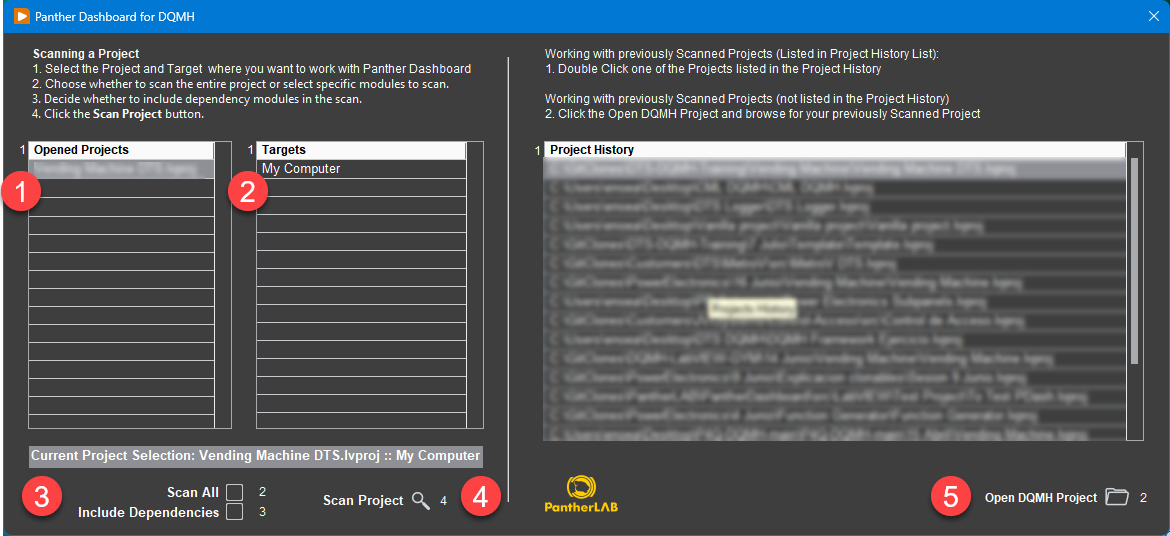
[1] Projects: Panther Dashboard will display all the projects currently opened by LabVIEW
[2] Targets: After selecting a Project, Panther Dashboard will display all the available targets.
[3] Scanning Options:
- Scan All: If checked, Panther Dashboard will search and scan all the modules in a projects; if unchecked, Panther Dashboard will display a list with all the modules to let the developer decide which ones will be scanned by Panther Dashboard.
- Include Dependencies**: If checked, Panther Dashboard will include DQMH Modules that are under LabVIEW Dependencies, including the ones in vi.lib or any other location.
[4] Scan Project Button: Click this button to begin the Scan.
[5] Open DQMH Project: To select a previously scanned project not listed in the Project History
*Panther Dashboard keeps track of the last 20 previously worked projects, right click the Project history to delete items or clear all the history. *Panther Dashboard saves this information in LabVIEW.ini file
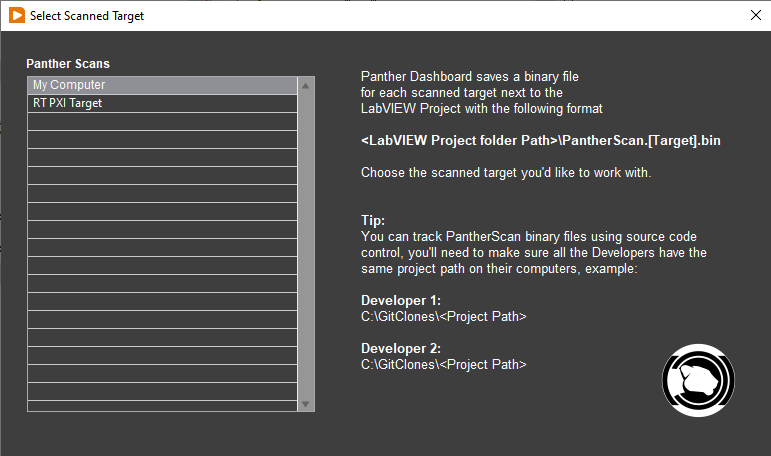
Projects with more than one target
If you use Panther Dashboard with projects with several targets, there will be one PantherScan.target.bin file per target, Panther Dashboard will search next to the LabVIEW project for these files, if there are more than one, it will display all the available scan files, for scans made with previous versions of panther dashboard, it will display the files as ‘Legacy Format PantherScan’, if you want to start fresh, you can delete all the PantherScan files and do a scan with this new version.
User Interface:
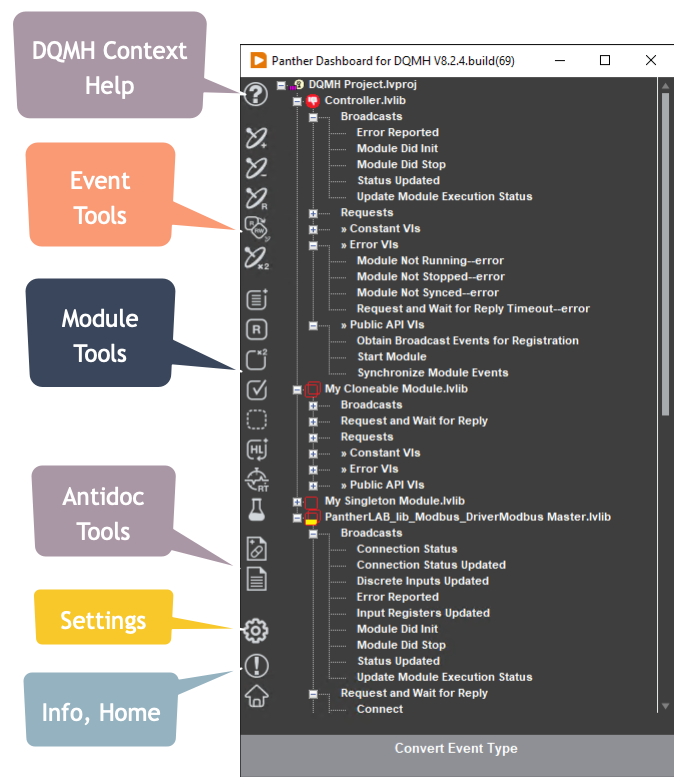
The main screen of Panther Dashboard is designed for quick access to DQMH scripting tools and provides a visual overview of your modules’ status (Running, Idle, Broken/Bad):
Panther Dashboard Glyphs
| Glyph | Description |
|---|---|
 |
DQMH Project |
 |
Singleton Module Running |
 |
Singleton Module Idle |
 |
Singleton Module under Dependencies |
 |
Clonable Module Running |
 |
Clonable Module Idle |
 |
Clonable Module under Dependencies |
 |
Not Runnable/Broken Module |
Panther Dashboard Buttons:
| Button | Name | Description |
|---|---|---|
| DQMH Context Help | Similar to LabVIEW’s context help, this window displays relevant information based on your currently selected module, project, or event. You can even edit the documentation. | |
| Add Event to Module | Add a new Event to the Module Selected | |
| Remove Event from Module | Removes an Event from the Module selected | |
| Convert Event Type | Converts a Request to a Request and Wait for Reply | |
| Rename Event | Renames an Event from the Module Selected | |
| Duplicate Event | Duplicates an Event from the Module selected, the target could be the same module or another module in the project | |
| Add Module to Project | Adds a DQMH® Module to the LabVIEW Project | |
| Rename Module | Renames a DQMH® Module | |
| Add Helper Loop to Module | Adds a Helper Loop to the Module Selected | |
| Validate Module | Calls the DQMH® Validation Tools | |
| Duplicate Module | Duplicates a module in the same project | |
| Create Module Template | Creates a DQMH Module template from the Module selected | |
| Create RT API Tester | Creates a New API Tester designed to run under RT Targets | |
| Add Unit Test for Event | Creates a new Unit test for an event of the Module Selected | |
| Call Antidoc to generate Project Documentation | Antidoc is an Open Source tool designed to create beautiful project Documentation | |
| Open Antidoc Output | Open the last rendered Antidoc Output | |
| About Panther Dashboard for DQMH | Displays About UI with some usefull links | |
| Export to CSV | Export the Module’s listed found in the project to a CSV file | |
| Home | Goes to Home Screen to select a different project to work with | |
| Configuration | Opens The Panther Dashboard Configuration UI |
Panther Dashboard Config UI
Panther Dashboard features a configuration UI that allows developers to modify specific Dashboard aspects and DQMH Framework INI Tokens. Upon clicking the Configuration button, the following interface will appear:
Optimized DQMH Tasks When using the Panther Dashboard, certain DQMH tasks often involve redundant selections. To streamline the workflow, the Dashboard can bypass the default DQMH UI to either execute tasks within the current project context or display a simplified interface.
Currently, the Panther Dashboard can skip the UI for the following two tasks:
-
Rename DQMH Module
-
Validate DQMH Module
DQMH Framework Configuration
- Include vi.lib into the search for right click menu ‘Find DQMH Broadcast Event Frames’
- Script Request and wait for Reply Payload as a Cluster

Panther Dashboard Scripting Tools (Module)
Panther Dashboard includes several Scripts to help you find, edit, debug your DQMH modules. These are the included Scripts.
- DQMH->
- Add Event
- Rename Module
- Duplicate Module
- Add Helper Loop do Module
- Validate Module
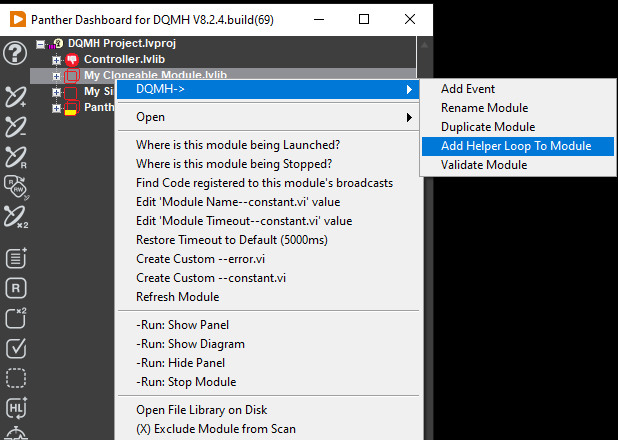
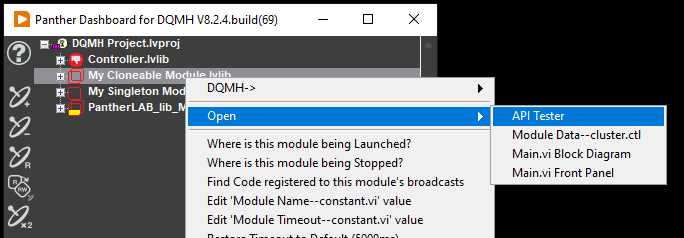
- Open
- API Tester: Opens the Selected Module’s API Tester
- Module Data–cluster.ctl: Opens Module’s Data Typedef
- Main.vi Block Diagram: Opens Module’s Main.vi Block Diagram
- Main.vi Front Panel: Opens Module’s Main.vi Front Panel
-
Where is this module being Launched?: Panther dashboard will search for Module Name.lvlib:Start Module.vi callers, including the Module’s API Tester, and it will display all the results in a list where you can double click each of the callers to navigate to the exact call location
-
Where is this module being Stopped?: Panther dashboard will search for Module Name.lvlib:Stop Module.vi callers, including the Module’s API Tester, and it will display all the results where you can double click each of the callers to navigate to the exact call location.
-
Refresh Module: Use this to refresh the DQMH Module, this will be needed if you start working in your DQMH project without having Panther Dashboard opened, if you have Panther Dashboard opened there is no need to refresh.
-
Find Coder registered to this module’s broadcasts: Panther dashboard will search for Module Name.lvlib:Obtain Broadcast Events for registration.vi callers including the Module’s API Tester and it will display all the results where you can double click each of the callers to navigate to the exact call location.
-
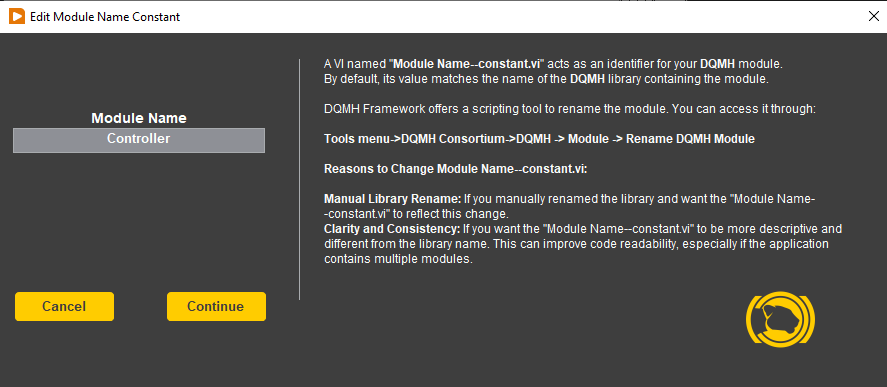
Edit Module Name Constant: Panther dashboard will search for Module Name.lvlib:Module Name–constant.vi block diagram string constant value and it will display the current Module’s name, you can change the name to help debugging, improving status, and error messages, etc.
- Edit Module Timeout Constant: Panther dashboard will search for Module Name.lvlib:Module Timeout–constant.vi block diagram numeric constant value, this value is used to populate a dialog where you can change the Module timeout, by default DQMH Framework uses 5000ms
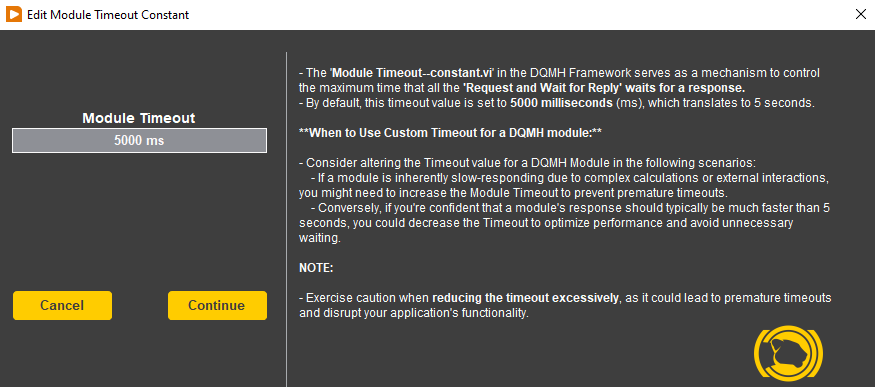
⚠️ Note: Exercise caution when reducing the timeout excessively, as it could lead to premature timeouts and disrupt your application’s functionality.
-
Restore Timeout to default (5000ms): Panther dashboard will search for Module Name.lvlib:Module Timeout–constant.vi block diagram numeric constant value and will overwrite the value with 5000, this is the framework default.
-
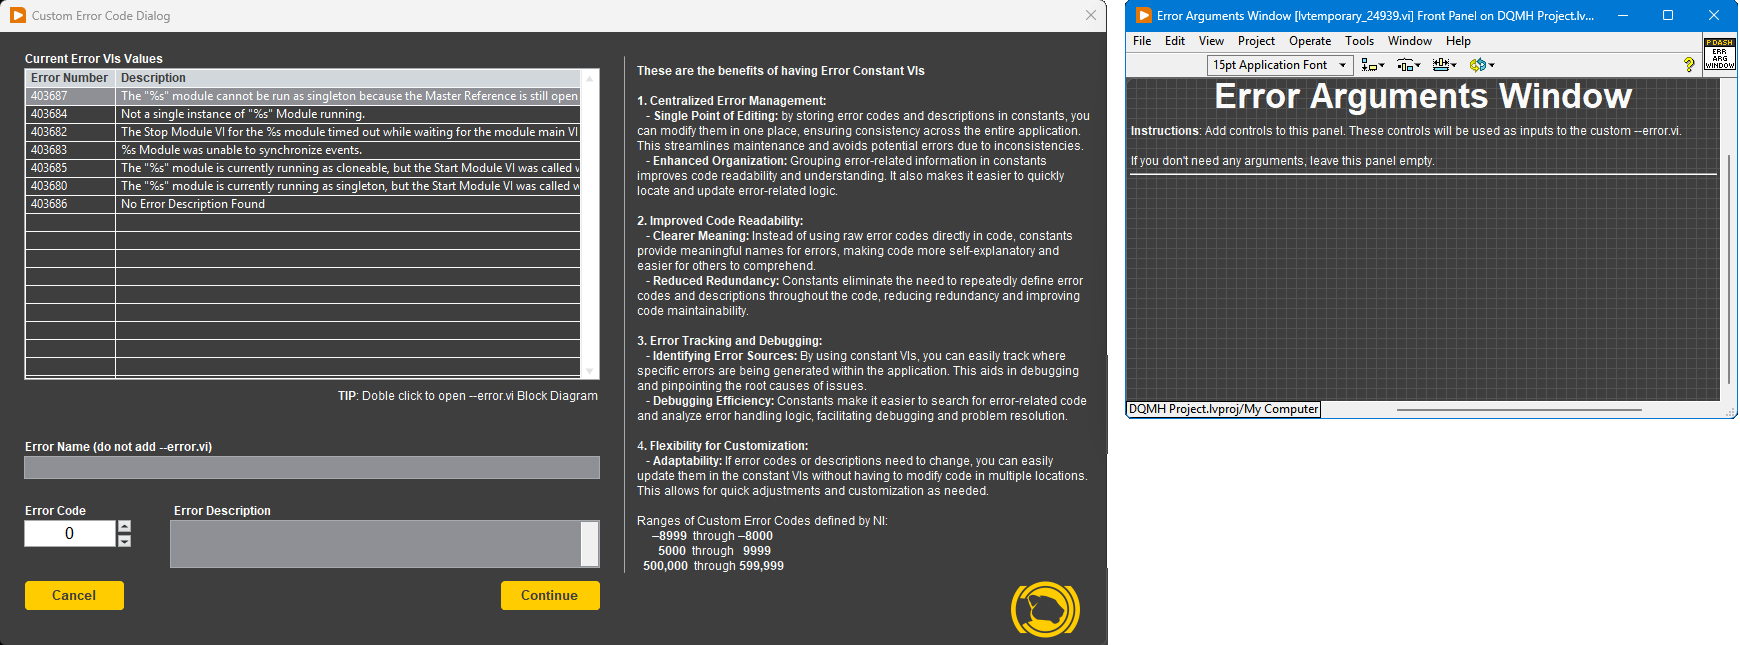
Create Custom – error.vi: Panther Dashboard will scan all the –error.vis files located in the module library folder, it will read all the Error Codes and their descriptions from the block diagram to help avoid duplicate codes, place the error name, do not add the –error.vi postfix, set the Error Code, it will need to be under the LabVIEW custom error code ranges (2), write an error Description, place any controls in the Error Arguments Window and click the “Continue” Button
TIP: Double Click to open the error vi.
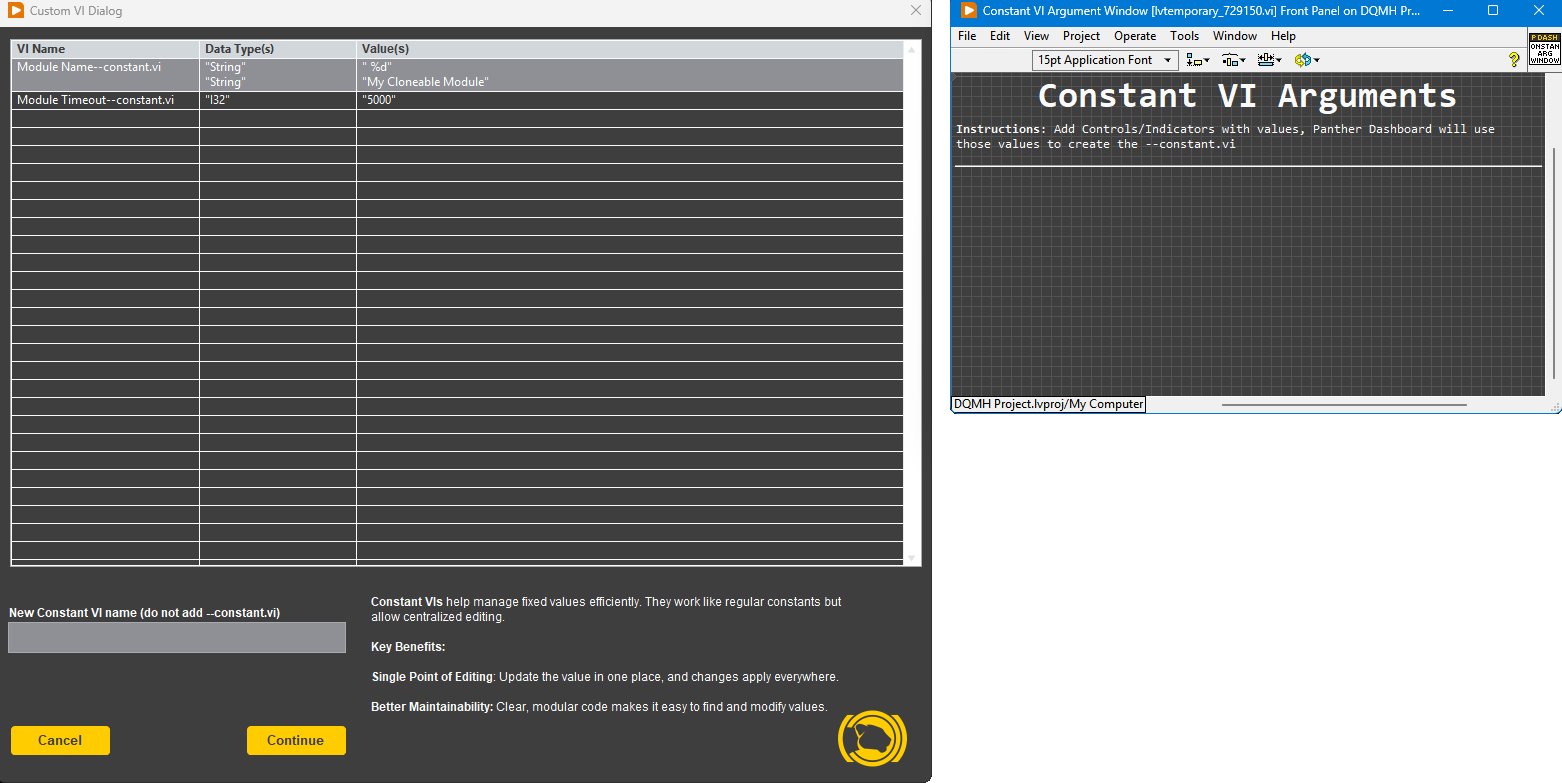
- Create Custom – constant.vi: Panther Dashboard will scan all the –constant.vis files located on the module library folder, it will read all the constant values from the block diagram, place the constant name, do not add the –constant.vi postfix, place any controls/Indicators in the Constant Arguments Window and click the “Continue” Button, make sure to set the values on the Argument window before clicking the “Continue” Button, Panther Dashboard will use those values to set the constants and create the –constant.vi.
- Run: (Show Panel, Hide Panel, Show Block Diagram, Stop Module): Executes these default requests without the need to open the API tester.
Panther Dashboard Scripting Tools (Event)
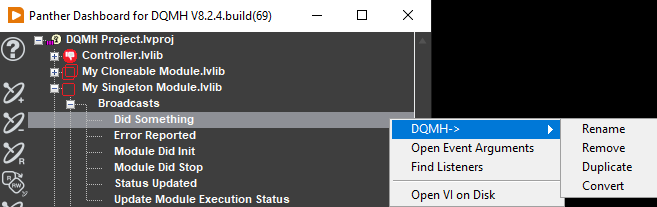
Panther Dashboard includes several Scripts to help you find callers, edit arguments, etc. These are the Scripts included.
Open Event Arguments This script is designed to open and edit the Event Arguments for the selected Event.
Script Workflow (Panther Dashboard):
- Open Module’s API Tester
- Open Module’s Main.vi Block Diagram and selects the EHL and MHL Related to the event.
- Open Fire Event VI Block Diagram
- Open Event Arguments Typedef.
Editing Process (DQMH Developer):
- Edit the Arguments Typeded, add/modify/remove arguments.
- Close and Save Event’s Typedef(s)
- Update Fire Event VI Block Diagram – Adjust the block diagram by adding/removing events as needed.
- Update Fire Event Connector Pane – Modify the connector pane to reflect any changes.
- Close Fire Event VI – Save and exit the VI.
- Update Main.VI Block Diagram – Modify the Event Handling Loop (EHL) and Message Handling Loop (MHL) cases related to the event.
-
Update Module’s API Tester – Ensure the tester reflects all changes for the Event.
- Find Callers: Search trough through the entire project for all the VIs calling the selected event, it will display a window with all the calls where you can doble click each of these calls to navigate exactly where the event is being called, Panther Dasbhoard will do a highlight to help you visualy identify the event call.
- Open Font Panel: It does exactly that, it will open the font panel of the selected event.
- Run: (Show Panel, Hide Panel, Show Block Diagram, Stop Module): Executes these default requests without the need to open the API tester.
- Open VI on Disk: Sometimes we need the exact location of an event, and this script helps navigate to your Operating System file path where the VI is located.
Panther Dashboard Scripting Tools (Project)
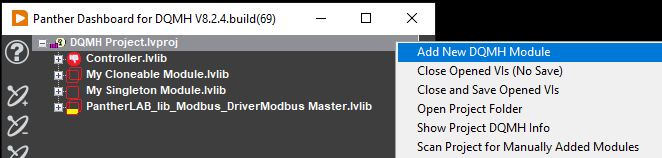
Panther Dashboard includes several Scripts to help you add new modules to the current scan, get a general view of your DQMH project.
-
Add New DQMH Module: Integrates a new DQMH module into the active project.
-
Close Opened VIs (No Save): Closes all open VIs in the current project without committing changes.
⚠️ Note: Any unsaved modifications remain in LabVIEW’s temporary memory. If you manually save the project later, LabVIEW will prompt you to decide whether to discard or save these changes.
-
Close and Save Opened VIs: Automatically saves all modifications and closes all open VIs within the current project.
- Open Project Folder: Launches the Windows File Explorer at the directory where the project file is stored.
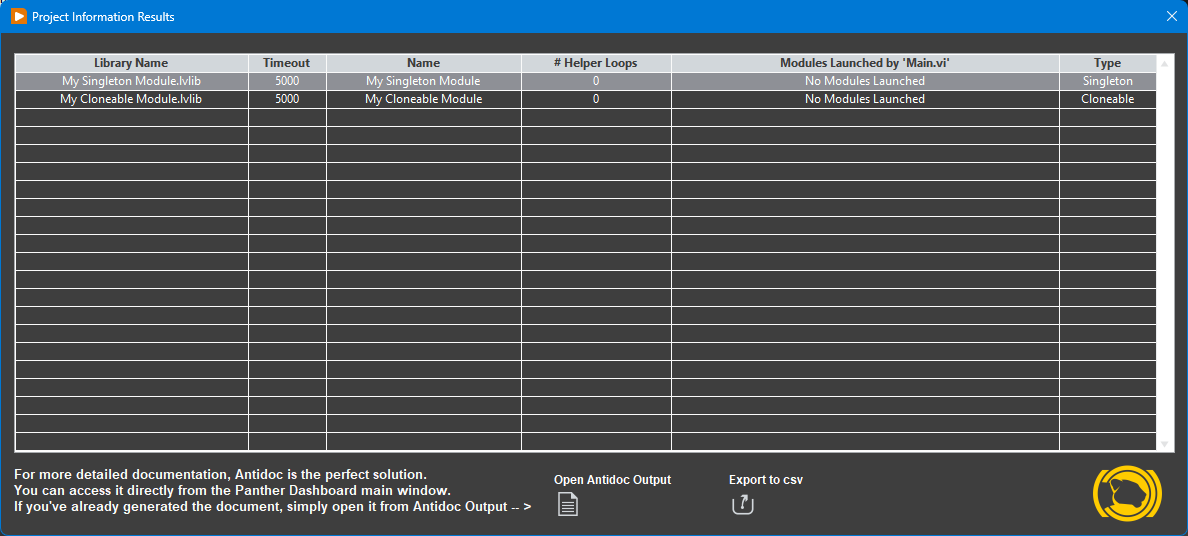
- Show Project DQMH Info: Scans your modules to parse the Module Name–constant.vi, Module Timeout–constant.vi values, library names, Number of Helper loops, Modules launched per module, and module type (Singleton, Cloneable)
- Scan Project for Manually Added Modules In typical DQMH workflows, modules may be added manually via palettes or file copying. Since the Panther Dashboard does not automatically track these external changes, this function allows the tool to cross-reference the project file with the current scan. The developer can then selectively add new modules to the dashboard. This targeted approach is significantly faster than a full project rescan, especially for large-scale applications.
Report Issues and Request Features:
Encountered an issue or have a feature suggestion?✍️ Let us know on GitHub: https://github.com/PantherLAB/PantherDashboard/issues
Struggling with DQMH projects? We can help! Our team (CLA, LabVIEW Champion, DQMH Trusted Advisor) offers LabVIEW development, LabVIEW training, and contracting services.
Ready to take the next step? Contact us today at [enrique.noe@pantherlab.com.mx] or [info@pantherlab.com.mx] to discuss your specific needs.